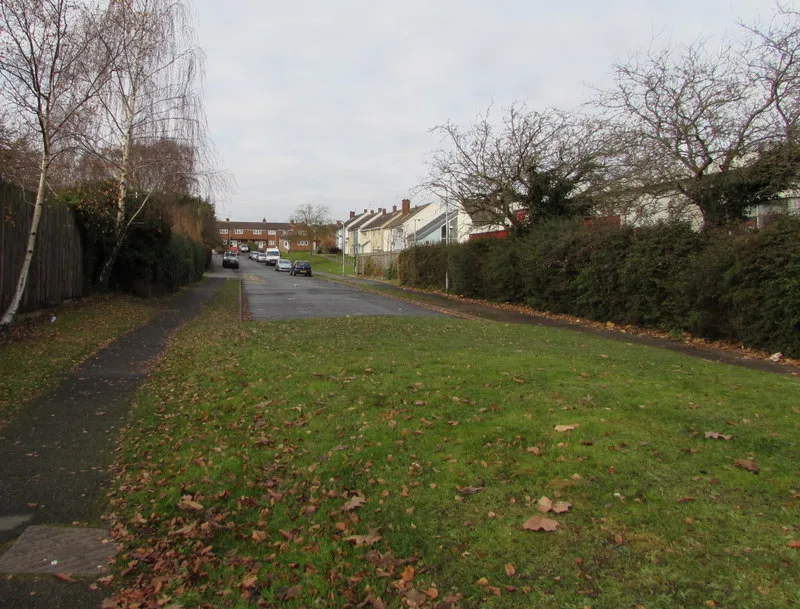

The district rate held at 2.5% in July. Behind it, Charford is on 6.0% and Slideslow on 1.0%, and both are wards of Bromsgrove town little more than a mile apart.
1,520 people in the Bromsgrove district were claiming unemployment-related benefits in July, according to figures published by the Office for National Statistics through nomis. That is 2.5 per cent of residents aged 16 to 64, the same rate as in July last year.
A flat district rate is the least interesting thing in the release. Split it by ward and the district contains a six-to-one gap, and the two extremes are both in Bromsgrove town.
Charford 6.0 per cent, Slideslow 1.0 per cent
Charford, on the southern edge of the town, records 6.0 per cent of working-age residents claiming. Slideslow, on the other side of the town centre, records 1.0 per cent.
Both are wards of Bromsgrove town itself rather than villages, and their centres sit about 1.3 miles apart. We checked that against the ONS ward boundaries for December 2024 and postcodes.io, which returns B60 postcodes in the unparished Bromsgrove town area for both.
Set against the rest of the country, Charford’s 6.0 per cent puts it among the highest 765 of England’s 6,807 wards, and Slideslow’s 1.0 per cent among the lowest 166. The median English ward is on 2.7 per cent.
The town is on both sides of the gap. Five of the seven highest wards are in Bromsgrove town itself or Catshill on its northern edge. So is Slideslow, at the bottom. This is not a town-versus-villages divide, and it is not a Rubery story either: Rubery North is on 2.2 per cent, below the district average.
Two rural-sounding wards sit near the top. Tardebigge, on 5.8 per cent, has the second highest rate in the district. The ward is larger and more mixed than the village name suggests: sampling its boundary against postcodes.io returns addresses in Finstall, Tutnall and Cobley, Bentley Pauncefoot and the unparished edge of Bromsgrove town.
Since January: Tardebigge down, Bromsgrove Central up
Ward figures in this series only start in January 2026, so there is no year-on-year comparison at ward level yet. There is a six-month one, and it is not uniform:
- Tardebigge fell furthest, from 7.1 per cent in January to 5.8 in July.
- Perryfields fell almost as far, 3.7 to 2.5.
- Bromsgrove Central rose furthest, 2.1 to 3.0.
- Sidemoor and Catshill North each rose 0.6 points, to 4.9 and 3.8.
- Charford barely moved: 5.9 in January, 5.9 in April, 6.0 in July.
Charford is the point worth holding onto. It has been the district’s highest ward in every month the series covers, and it has not improved while the district average has stayed still.
Both ends of the age range rose, the middle fell
The district total is up 50 on July last year, from 1,470 to 1,520. The age split shows that the total moved less than the parts:
| Age band | July 2025 | July 2026 | Change |
|---|---|---|---|
| 16 to 24 | 260 | 305 | +45 |
| 25 to 49 | 835 | 815 | −20 |
| 50 and over | 375 | 405 | +30 |
| All aged 16+ | 1,470 | 1,520 | +50 |
Claims among the district’s under-25s rose 17.3 per cent in a year, against 9.7 per cent across the UK. Claims among the over-50s rose 8.0 per cent, against 1.8 per cent across the UK and 0.4 per cent across Worcestershire. The 25 to 49 band, which is most of the claimant count, fell.
Bromsgrove is not the worst in the county on either measure taken alone. Malvern Hills saw under-25 claims rise 27.8 per cent and Wyre Forest 19.4 per cent. But Bromsgrove is the only one of the six Worcestershire districts where the youngest and the oldest bands both rose by more than 5 per cent while the 25 to 49 band fell. In Malvern Hills and Wyre Forest the middle band rose too; in Worcester and Wychavon the over-50s fell.
What it means for you
If you are 18 to 24 and out of work, this is the group the district’s figures are moving on, and there is local provision aimed at it. Worcestershire’s Jobcentre and youth employment support is the national route, and Bromsgrove District Council lists its own employment and skills support on its advice pages.
If you are over 50 and claiming, you are in the fastest-growing band relative to the national picture. The district’s over-50 claims rose four times faster than the UK’s over the past year.
If you are reading these as a measure of unemployment, be careful. The claimant count records people claiming Universal Credit who are required to look for work, plus the remaining Jobseeker’s Allowance claimants. It is not the unemployment rate, and it moves when benefit rules change as well as when the job market does. Someone working part time on a low income can be counted.
If you are comparing wards, note that nomis rounds ward counts to the nearest five. The 30 Bromsgrove wards sum to 1,525 against a district total of 1,520, and that five-person difference is rounding, not a missing ward.
Related
- Bromsgrove house prices hit a record £339,163: the district average in June 2026.
- Bromsgrove housing register: everyone must reapply: the 1 October cut-off to keep your waiting date.
- Bromsgrove roadworks and travel: what is shut and what is coming.
- Bromsgrove planning news: the housing target and the sites in the draft plan.
Sources
- ONS claimant count via nomis, dataset NM_162_1, for the district total, the age bands and the ward rates, read on 23 August 2026. District figures are for the Bromsgrove district, ONS code E07000234.
- ONS ward boundaries, December 2024 and postcodes.io for the parish and settlement each ward covers, and for the distance between ward centres.
- Claimant count guidance, ONS for what the measure does and does not include.
Claimant count figures are not seasonally adjusted at district and ward level. Ward counts are rounded to the nearest five.
Have your say