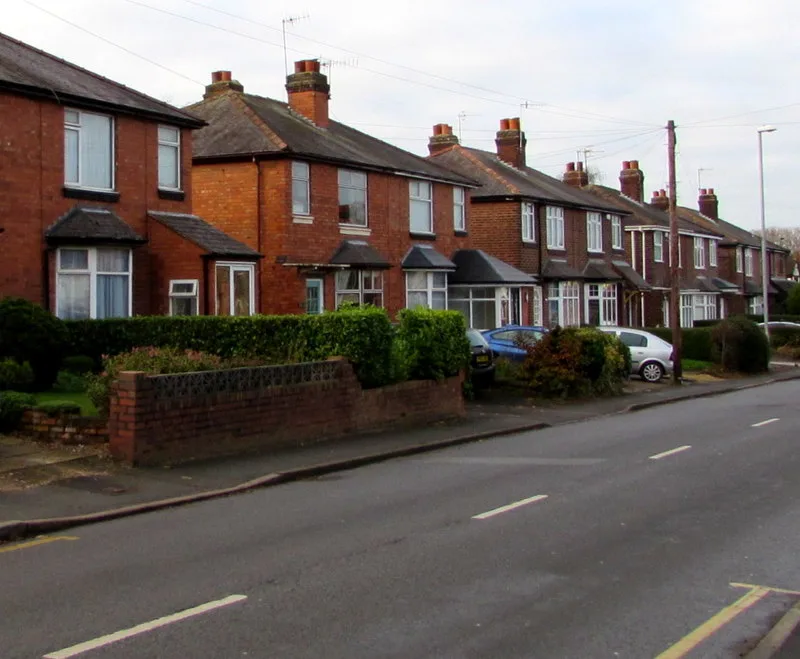

The average Bromsgrove home was £335,607 in July, up 2.3% on the year. June's record £339,163 has been revised down by £3,380 and is no longer a record.
The average home in the Bromsgrove district sold for £335,607 in July 2026. That is 2.3 per cent higher than a year earlier, a rise of £7,548, according to the UK House Price Index published on 16 September.
The bigger change is to the month before. A month ago the index gave June as a record £339,163 for the district. June now reads £335,783. The Land Registry has revised it down by £3,380, and Bromsgrove is no longer at an all-time high.
The record that went away
We reported the June figure on 23 August as the highest average in the district’s records, which go back to 1995. On the data published then, it was.
The new release changes three things:
- June 2026 is now £335,783, down from £339,163
- June’s rise on the year is now 1.0 per cent, not 2.0 per cent
- the highest month on record is now November 2025, at £336,409
July’s £335,607 sits £802 below that November peak. On the month, prices slipped 0.1 per cent.
Revisions like this are routine. Sales take weeks to reach the Land Registry, so the first figure for any month is built on an incomplete set of them. A month ago the revision went the other way: May was pushed up by £4,279. The latest two or three months are always the least settled.
Second in Worcestershire, and growing faster than most
Over the year, Bromsgrove’s 2.3 per cent rise was the second fastest of the six Worcestershire districts. It was also ahead of the county, the region and England.
Malvern Hills is still the dearest district in the county, at £350,772 and up 5.5 per cent. The gap to Bromsgrove is now £15,165.
Wychavon was £7,234 behind Bromsgrove in June, on the revised figures. In July it fell 1.8 per cent in a single month, to £322,623, and it is now £12,984 behind.
Redditch and Wyre Forest both fell over the year, by 1.9 and 0.6 per cent.
Against the wider picture, Bromsgrove’s year was a little better than average:
- Worcestershire rose 1.0 per cent, the West Midlands region 1.5 per cent and England 1.1 per cent.
- Bromsgrove’s annual rise was the 132nd largest of the 295 English local authority areas.
- 85 of those 295 areas fell over the year.
The rankings come from the Land Registry’s full UK HPI data file for July 2026, which carries every area on the same basis.
Semis did best, flats fell
| Property type | July 2026 average | Change on the year |
|---|---|---|
| Detached | £524,379 | +1.8% |
| Semi-detached | £327,607 | +3.2% |
| Terraced | £268,861 | +2.8% |
| Flat or maisonette | £152,952 | -0.6% |
| All types | £335,607 | +2.3% |
Semi-detached homes rose most, by 3.2 per cent. Terraces were close behind. Flats were the only type to fall.
A first-time buyer in the district paid an average of £259,573 in July, up 2.6 per cent on the year.
Fewer sales than last spring
The Land Registry recorded 66 completed sales in the district in May 2026, the latest month it gives a count for. In May 2025 there were 87. Sales counts lag the prices by about three months, and they are revised too: March and April 2026 now read 87 and 93.
With well under a hundred sales a month across every town and village in the district, a handful of expensive sales can move the average. So can a handful of sales registered late, which is what revisions are made of.
What it means for you
- If you are selling, prices are up on the year, but not at a record. Use the July figure, not the June one you may have read.
- If you own a semi or a terrace, yours is the part of the market that moved, at around 3 per cent.
- If you own a flat, the average fell 0.6 per cent on the year.
- If you are buying, the gap to Malvern Hills widened again. Bromsgrove is still about £15,000 cheaper on average.
- If you are watching the monthly numbers, treat the latest two months as provisional. June has now moved by £3,380 in a month.
For the price of a specific house, the district average will not help. Every completed sale in England and Wales is free to search by street on the HM Land Registry Price Paid service.
The UK House Price Index is a mean average, not a median, and it is adjusted for the mix of homes sold. It is not the price of a typical Bromsgrove house, and it is not comparable with asking prices on the property portals.
Related
- Bromsgrove house prices: prices by village, from Barnt Green to Rubery.
- The June record, as first published: now superseded by this release.
- Bromsgrove planning news: the housing growth behind the numbers.
- Bromsgrove train times: 23 minutes to Birmingham.
Sources
- UK House Price Index, Bromsgrove, July 2026 for the district average, the monthly and annual changes and the property-type and first-time-buyer splits.
- UK HPI full data file, July 2026 for the revised June and November 2025 figures, the Worcestershire, West Midlands region and England comparisons, the rankings against all 295 English local authority areas and the sales volumes.
- UK HPI full data file, June 2026 for the June figure of £339,163 as first published.
- Malvern Hills and England, July 2026.
- HM Land Registry Price Paid search for an individual address.
All Land Registry figures read on 17 September 2026. The most recent months are provisional and are revised as more sales are registered.
Have your say