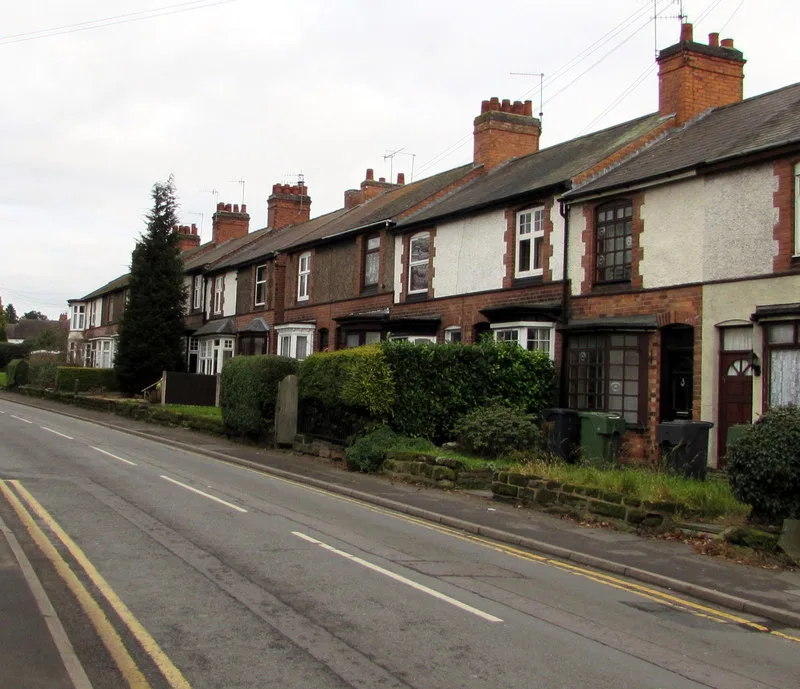

The average Bromsgrove home reached £339,163 in June, the highest in Land Registry records back to 1995. May's fall was revised away. Malvern Hills is still £11,743 dearer.
The average home in the Bromsgrove district sold for £339,163 in June 2026. That is the highest figure in the UK House Price Index for this district in records that begin in January 1995.
It is a sharp turn. Three months ago the same index had Bromsgrove as the only Worcestershire district where prices were falling. Two things have changed since. Prices rose in April, May and June. And the Land Registry went back and revised the earlier months upward.
May’s fall was revised away
When the May figures were first published, the Bromsgrove average read £330,194 and the district was down 1.0 per cent on the year. The same month now reads £334,473, and up 0.3 per cent.
That is a revision of £4,279 on a single month, and it changes the sign. The district was not falling in May. It only looked as though it was, because sales take weeks to reach the register and the first version of any month is built on an incomplete set of them.
This is normal and it is not a correction of an error. The UK House Price Index revises every month as more completions are lodged, and the most recent two or three months are always the least settled. It is worth knowing before you read any single month as a verdict on your own home.
Where June sits
The £339,163 average is up 1.4 per cent on May and 2.0 per cent on June 2025, when it was £332,446. In cash terms the year added £6,717.
Set against the rest of England, the month was strong and the year was ordinary:
- The 1.4 per cent monthly rise was the 42nd largest of the 295 English local authority areas.
- The 2.0 per cent annual rise ranked 114th lowest of 295, close to the middle. England as a whole rose 1.8 per cent.
- 62 of the 295 English areas fell over the year. Bromsgrove was not one of them.
All of those rankings come from the Land Registry’s full UK HPI data file for June 2026, which carries every area on the same basis.
Malvern Hills is still ahead, and pulling away
Bromsgrove spent years as the most expensive district in Worcestershire. It is not any more, and the gap got wider this month rather than narrower.
Malvern Hills averaged £350,906 in June, up 8.0 per cent on the year. It is now £11,743 clear of Bromsgrove. In May the gap was £6,853, and in June 2025 Bromsgrove was £7,580 ahead.
Wychavon, on £328,015 and rising 5.6 per cent, is closing from the other side. It is now £11,148 behind Bromsgrove. A year ago it was £21,793 behind, so that gap has almost exactly halved in twelve months.
Redditch, the district next door, is the only Worcestershire district still falling, at minus 0.5 per cent.
The rise came from the middle of the market
The type-by-type figures show where the money moved:
| Property type | June 2026 average | Change on the year |
|---|---|---|
| Detached | £530,198 | +0.9% |
| Semi-detached | £331,064 | +3.1% |
| Terraced | £271,190 | +3.0% |
| Flat or maisonette | £155,017 | +0.2% |
| All types | £339,163 | +2.0% |
Semis and terraces did the work. Both rose about 3 per cent. Detached houses, at £530,198, added less than 1 per cent, and flats effectively stood still at £155,017.
That matters locally because the ordinary Bromsgrove family house is a semi, and it is the part of the market that has moved. The average flat is now worth less than half the average semi.
A first-time buyer in the district paid an average of £262,146 in June, up from £255,549 a year earlier.
Very few homes actually sold
The Land Registry recorded 88 completed sales across the whole district in April 2026, the most recent month it publishes a count for. Sales figures always lag prices by about three months, because the register keeps filling in.
Set that against last year’s stamp duty distortion and the picture is clearer. The district recorded 260 sales in March 2025, the month before the threshold change, and 53 in April 2025, the month after. The same two months in 2026 recorded 84 and 88. Comparing this spring with last spring tells you about a tax deadline, not about Bromsgrove.
With under a hundred completions a month across every town and village in the district, one expensive street can move the average. That is another reason to read the direction rather than the decimal point.
What it means for you
If you are selling, the market is behind you for the first time in about a year, but only just. Prices are up 2.0 per cent on the year. Malvern Hills is up 8.0 per cent and Wychavon 5.6 per cent. A valuation borrowed from a sale in another district will be wrong. Semis and terraces are the strong part of the market. Detached houses added under 1 per cent and need the most realism.
If you are buying, the record headline overstates the change. In real terms the district average is £6,717 higher than a year ago, which is roughly 2 per cent, and the flat market has not moved at all. Check what the commute costs before you fix on an asking price.
If you are staying put, the useful takeaway is the revision. Any figure you read for May, June or July will move again in the next few releases, and it has just moved by more than £4,000 in a single month. Do not make a decision on one month’s number.
If you want the price of a specific house, the district average will not give it to you. Every completed sale in England and Wales is public and free to search by street or address on the HM Land Registry Price Paid service.
The UK House Price Index is a mean average, not a median, and it is adjusted for the mix of homes sold. It is not the price of a typical Bromsgrove house, and it is not comparable with the asking-price averages on the property portals.
Related
- Bromsgrove house prices: the full picture, including the three-fold gap between Barnt Green and Rubery.
- Bromsgrove planning news: the 12,155-home target these prices help set.
- Buntsford Hill 293 homes plan: comments close on 8 September.
- Bromsgrove train times: 23 minutes to Birmingham and what the season ticket costs.
Sources
- UK House Price Index, Bromsgrove, June 2026 for the district average, the monthly and annual changes and the property-type and first-time-buyer splits, with the equivalent pages for May 2026 and June 2025.
- Malvern Hills, Wychavon, Worcester, Wyre Forest, Redditch, Worcestershire and England for the comparisons.
- UK HPI full data file, June 2026 for the rankings against all 295 English local authority areas and for the sales volumes.
- ONS and HM Land Registry house price visualisation for Bromsgrove.
- HM Land Registry Price Paid search for an individual address.
All Land Registry figures read on 23 August 2026. The most recent months are provisional and are revised as more sales are registered.
Have your say